4.1.2How accurate is a Riemann sum?

Properties of Definite Integrals

4-13.

Use the numerical integration feature of a graphing calculator to evaluate each of the integrals below. Then, for the region associated with each integral, evaluate a Riemann sum to approximate the area under the curve with 20 rectangles. Finally, compare these results.

  1. ππ/23sin(2x)dx 

  2. 55(x23)dx 

4-14.

Without a calculator, graph and shade the region represented by the integrals below. Then, rewrite this expression using only one integral. Use a calculator to verify that the sum of the three integrals is equal to the single integral.

13(9x2)dx+38(9x2)dx+21(9x2)dx

Compute without a calculator

4-15.

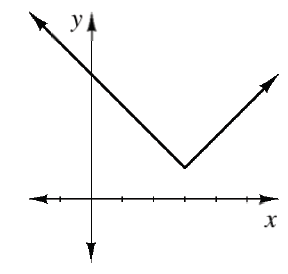
Draw and shade the region representing 504xdx.

  1. Evaluate the integral geometrically and then verify your result using the numerical integration feature of a graphing calculator. What happened? 

  2. Why is 504xdx different than 054xdx

4-16.

Does abf(x)dx=baf(x)dx if ab? Why or why not?
Examine the limit of a Riemann sum, limni=0n1banf(a+bani) as you answer this question. 

4-17.

COMBINING REGIONS

Rewrite each of the following expressions as a single integral.

  1. 16f(x)dx36f(x)dx 

  2. 310f(x)dx+93f(x)dx 

  3. cdf(x)dx+ecf(x)dx 

  4. ax+hf(t)dtaxf(t)dt 

  5. When can we combine multiple regions? When can we rewrite them? Use the above examples to justify your answer. 

Review and Preview problems below

4-18.

Evaluate the following definite integrals. Homework Help ✎

  1. 03xdx 

  2. 03(x)dx 

  3. 30xdx 

  4. 30(x)dx 

4-19.

For each function below, write the equation of its general antiderivative, F. Homework Help ✎

  1. f(x)=2 

  2. f(x)=32x1/2 

  3. f(x)=3x2+6x 

  4. f(x)=2(x+3) 

4-20.

Differentiate each function below. That is, write an equation for the slope function, f. Homework Help ✎

  1. f(x)=6(x2)3 

  2. f(x)=2sin(x) 

  3. f(x)=(x+5)(2x1) 

  4. f(x)=x36x2+2xx 

4-21.

Describe what a “slope function” is in complete sentences. What is its purpose? Give some examples of functions and their slope functions. Homework Help ✎

4-22.

The value of 0πxsin(x)dx is π . 4-22 HW eTool Homework Help ✎

  1. Without a calculator, evaluate  20πxsin(x)dx and ππxsin(x)dx.

  2. Use a graph to justify your conclusion.

4-23.

For parts (a) and (b) below, trace f(x) on your paper. Then, using a different color, sketch the graph of y=f(x) for the function given. Homework Help ✎

  1. First quadrant, x axis with 5 equally spaced tick marks, y axis unscaled, with upward V, vertex at third tick mark & about 1 fourth up, left ray goes through y axis, about 3 fourths up on y.

  1. First quadrant, x axis with 5 equally spaced tick marks, y axis unscaled, with period curve labeled, sinusoidal function, coming through y axis about half way up, rising, then falling equal distance up & down from y intercept.

4-24.

Evaluate the following limits. Homework Help ✎

  1. limx2x24x2 

  2. limh0(1+h)21h 

4-25.

A cone has a height of 10 inches and a radius of 4 inches. If a plane cuts the cone h inches above the base of the cone, write an expression for the area of the circular cross-section. Homework Help ✎

Cone with vertex on top, dashed vertical segment labeled 10, from vertex to center of circular base, & dashed segment from center of base to edge of circle labeled 4, & circle around the cone, in top half, distance between circles labeled, h.

4-26.

Georg Friedrich Bernhard Riemann (1826-1866) is the person who formulated the modern definition of an integral. He decided that it was not absolutely necessary that each rectangle have the same width. They do not even need to be the same type (i.e. they all do not need to be endpoint or midpoint rectangles).


Examine the rectangles used at right to estimate the area under a curve. Will they still give a good estimate of area even though the rectangles do not have the same width? Homework Help ✎

First & second quadrants, increasing cubic coming from bottom left of negative 5, changing from concave down to concave up at about (0, comma 5.5), continuing through the point (4, comma 8), with 4 shaded rectangles between the curve & x axis, from negative 4 to 0, with midpoint of top edge on the curve, & 9 unequal width rectangles between the curve & x axis, from 0 to 5, with the skinnier ones having top right edge on the curve, & wider ones have midpoint on the curve.